The internet has become what television was to the marketing world twenty years ago– a vast, open field for advertising, which is effecting the buying habits of more people than anything has in the history of the world. In our current web culture that is characterized by immediate gratification and users who have the shortest attention spans the world has ever seen, utilizing eye-catching visuals is as important now as a commercial slot during prime-time television used to be.
The internet surpasses television because it not only offers visual content but also an interactive feature which is playing a large role in marketing. Content is coming from both directions, both user-generated and produced by marketers. The power of visual content to engage audiences can be observed in the average monthly use per visitor on varying social networks as reported by Statista. The more visual a platform is, the more engagement it is receiving.

Visual Content on Various Platforms
Of all social media content, according to this infographic from February, 63% are images and 32% are videos. To gain a deeper understanding, another study showed that an average of 1.8 billion photos are shared via social media platforms every day. For a bit of perspective, that number was only around 400 million in 2012.
 Let’s take a look at a few visual content related stats for the different social media platforms.
Instagram, a strictly photo-sharing website has the largest reported increase of usage in recent years when compared to any other social media outlet – totaling about 900% between 2011 and 2013.
Facebook users are reported to post 350 million photos on the platform every day. It has also been found that Facebook posts involving photos or video content are 180% more likely to engage audiences. Posts with photos are also twice as frequent as text only updates.
YouTube- As of April of 2014, 6 billion hours of YouTube videos were watched each month. Additionally, 700 YouTube videos are shared on Twitter every minute. (Learn more in depth stats and a detailed feature comparison of Youtube in this post)
Twitter: Tweets that contain images are said to be 150% more likely to be retweeted.
As you can see, visual content has a clear effect on marketing results and reach via social media platforms.
Different Types of Visual Content
In general, there are three leading types of visual media that are used in marketing – videos, images, and infographics. Which is most utilized and effective?
 Images
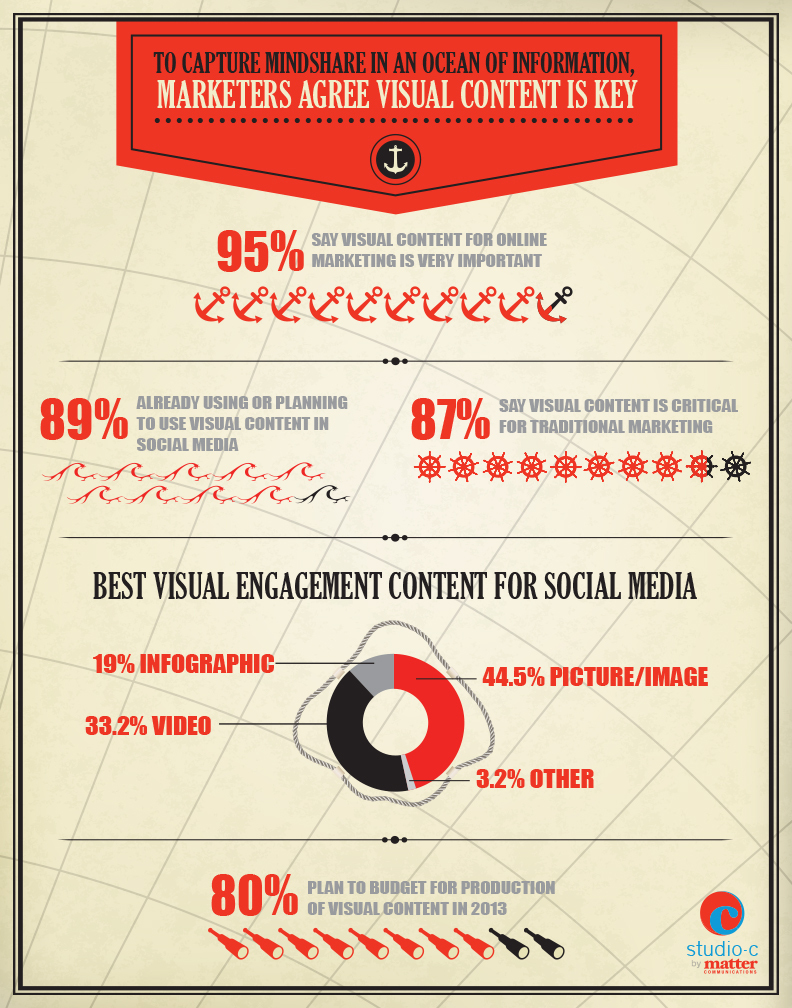
According to an infographic provided by thenextweb,com, images make up 44.5% of the visual engagement content on social media platforms. This makes it the most used method of visual content. With Facebook being one of the largest social platforms, it is no surprise that the trend in the use of images follows suit. Emarketer.com found 54% of content posted to Facebook in January of 2014 were photos, and by March the share was up to 75%. Images can be simply snapped via a smartphone camera and uploaded with a caption, or professionally shot and edited.
Starbucks used user generated content in visual content marketing campaigns this year. One particular marketing move was sharing a customer’s photo from Instagram of their Starbucks coffee cup with hearts drawn on it. The response was over 78,000 likes, 1,500 shares and 460 comments. They aimed to show appreciation, promote the business and bring customers closer together and succeeded in doing so.
Video
Video makes up 33.2% of visual engagement content used on social media platforms in marketing efforts. As shown above, video made up a much more modest portion of the content shared on Facebook with 3% in January 2014, and 4% by March. Videos are more common place on YouTube, where they are then shared via other platforms. A video is a very powerful way of communicating a message, but is also generally more difficult and costly to produce than an image.
One example of a marketing move using video is when Hyundai and Copa90 made a YouTube video promoting an all-expense paid trip to the 2014 World Cup. Viewers had to go to Hyundai’s Facebook page, and enter by uploading a video of themselves showing their goal celebration. 700 lucky entries will win tickets to the event. The aim was to focus on the emotional response created by futbol and inspiring that in all their viewers. This move was part of their sponsorship of the World Cup which aimed at increasing sales through brand recognition.
Infographics
While infographics hold a significantly lower percentage of the visual engagement share on social media at 19%, the content market institute found a large increase of 13% in the use of infographics by B2B marketers in the last year. This increase occurred while the other tactics remained fairly consistent. See the chart below for this year’s results.
 Generally, an infographic provides statistics or information about a topic, but presents it in a way that is more visually stimulating and accessible than plain text. They are often used to highlight points in an article or point out impressive and interesting statistics. Although they can require more skill or outsourcing to create, they are useful to break up large blocks of text and engage interest in the rest of the content on the page.
Why Social Media Platforms?
It has been established that visual content engagement strategies are working, but why utilize social media platforms? The reason is that these platforms are all about who a consumer is – their age, social demographic, interests, personality, etc. All of these things inform businesses of the kinds of products that a person will likely be interested in, and as a result, marketing can (and has) become more targeted and effective. The strenuous work that marketers had to do trying to figure out what their customers wanted, has become so much easier because those same customers readily announce exactly what they want to the world at large. They even partake in generating content for a business’s page.
As shown in the case studies in this article, by flipping campaigns around to be user-generated, companies can actually use visual content which is provided by the customers. By running contests with some kind of incentive, a great deal of traffic, brand recognition and reach can be achieved.
A Trend Worth Investing In
The reason that visual content is taking off so quickly is twofold. The first is that the development of smartphones and other mobile devices with wireless connectivity has greatly increased the way that people are able to share photos, videos, and other visual content. The second is in the way that the human brain processes information. 90% of the information collected by the senses and transmitted to the brain is visual. Because this process is so effortless, visual information is processed much quicker than anything else, and much quicker than textual information, which must be actively engaged to comprehend. But really, the numbers speak for themselves: humans process visuals sixty thousand times faster than text, and most people remember 80% of what they see, but only 20% of what they read. As a result, visual content via images, video and infographics through various social media platforms is a way to reap the greatest returns on your marketing efforts.
MavSocial is the leader in social media visual content management solutions. It allows marketers to easily upload, store, manage and publish videos and other rich media directly to Facebook, Twitter, LinkedIn, YouTube and Tumblr. So why not sign up for a free account now and see how MavSocial can help make your social media visual content marketing easier.
From MavSocial | Complete Social Media Visual Content Management & Publishing Software